CS PaletteShare
Measure and work with palettes of colours under a range of standard illuminants - D65, D50, tungsten and fluorescents. Supports chromatic adaptation and multiple colour difference equations. Calibrated monitor technology means accurate colour viewing.
Drag groups of colours to copy and swap; copy to the clipboard for integration into other applications.
Import from external colour formats through a simple drag and drop operation. Saved palettes are immediately available to distant colleagues, either as palettes, or as different "views" via an internet browser with our CS Toolbar technology.
Colour manipulation tools allow for visual selection of colours, measurement by spectrophotometer or direct keyboard data entry. Advanced search tools can find samples by colour or name, or find the closest matches for an entire palette in one go. It's lightning fast too - search 16,000 colours for the closest matches in 5 seconds! Add any number of company specific attributes such as alternate names, tracking and other data to the colours, all fully searchable.
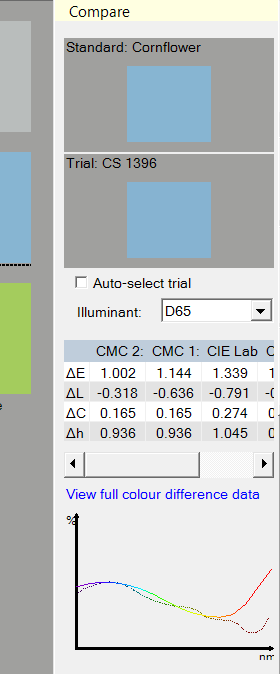
Visual, graphical and numeric colour comparison tools are fully integrated into the system, allowing tolerances to be evaluated for quality assurance purposes.
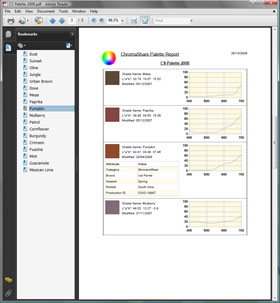
Also standard is the ability to create fully indexed palette reports, which are also exportable as PDFs or Excel documents.
CS PaletteShare Functionality
Sample and Palette Search
Search for samples by colour or by name, either singly or as an entire palette. Selectable illuminant and colour difference equation. Search in sidebar maybe pinned to workspace. Search in:
- Current, active palette
- All open palettes
- Selectable set of stored palettes visible to user
- Supplier libraries from third parties
Search options:
- Limit search to best matches (1-1000) (1-25 for Supplier libraries)
- Match sample attributes (season, brand etc)
- Match within specified date range
Additionally, when searching a whole palette for matches, either the total number of matches per sample may be set (1-5) or a ΔE tolerance specified. Selected palettes may be searched separately.
Sample Appraisal
Ability to compare multiple samples to the selected (standard) in a variety of ways:
Visual Background colour and illuminant are fully selectable through menu and keystroke options.
- Tile View - standard against multiple adjacent samples
- Target View - Standard at centre of target composed of comparisons
- 3D Graph View - standard as centre of zoom-able, rotatable 3 dimensional graph in either L*a*b* or ?L, ?C, ?h colour spaces, optionally showing ΔE tolerance
with selectable illuminant and background colour (menu and keystroke selectable).
Numerical Optionally selectable reflectance curve graph.
Colorimetric properties table: The table allows the selection and display of:
- Colour Name (optionally with out of tolerance warning), CIE Lab, CIE LCh, CIE XYZ, CIE xyY
- ΔE and ΔL, ΔC, Δh components of multiple colour difference equations
- Dyer's terms description of colour difference in words
- 555 Shade sorting
- Colour inconstancy, Metamerism Index, Whiteness index, Yellowness index, Tint index.
This colorimetric table is fully sortable by clicking on column heading. Columns are ordered by simple drag and drop procedure, and selection of data fields is made within the table, too. All settings are remembered for next time.
System Requirements
- Operating System:
- Windows XP, Windows Vista, Windows 7
.NET 3.5 runtime. - Supported Monitor Probes:
- ColorVision/Datacolor Spyder 2, Datacolor Spyder 3, eye-one display, or any that produce ICC profiles
- Supported Spectrophotometers:
- Datacolor, GretagMacbeth/X-Rite Models
- Supported Colour Formats:
- ChromaShare CPX, Datacolor QTX, X-Rite CxF v2 and CxF v3, Society of Dyers and Colourists SDC (Current Draft Specification), Adobe Swatch Exchange (ASE)

Work with libraries of colour using PaletteShare

Powerful Search Options

Detailed Colour Comparison

Full Reporting Capabilities with export to Excel and PDF

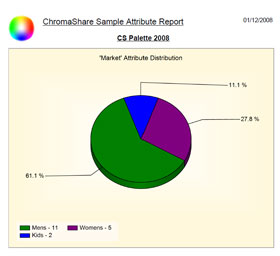
Exportable Graphical Reports
Email info@chromashare.com for more information
© 2011 ChromaShare Ltd All Rights Reserved

.gif)